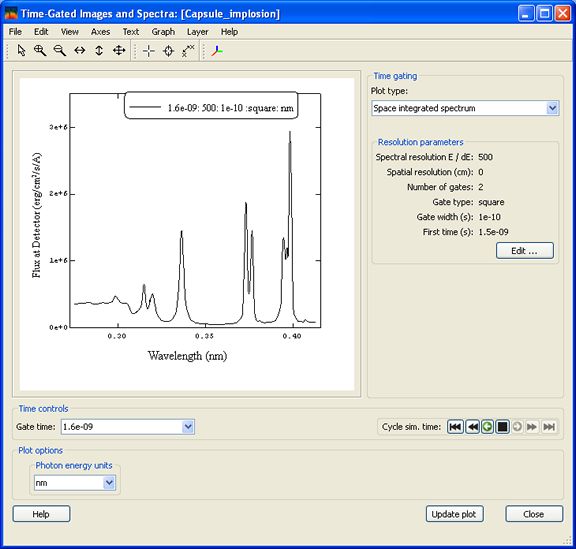

Time-gated integrals of the spatially integrated spectrum can be shown by selecting Space integrated spectrum in the Plot type combo box.
Before any image is shown, the time gate parameters must be entered by clicking on the Edit... button in the Resolution parameters frame. See Spectral and Image Resolution for details on the settings. A spectral resolution may also be set.
Images at other gate times are displayed by:
Functionality from left to right:
For information on how to modify the plot parameters or save images from the graph, see the PrismPLOT Users Guide.
| Copyright © 2024 Prism Computational Sciences, Inc. | VISUALIZER 20.5.0 |